(2024.12.22) 수정됨.
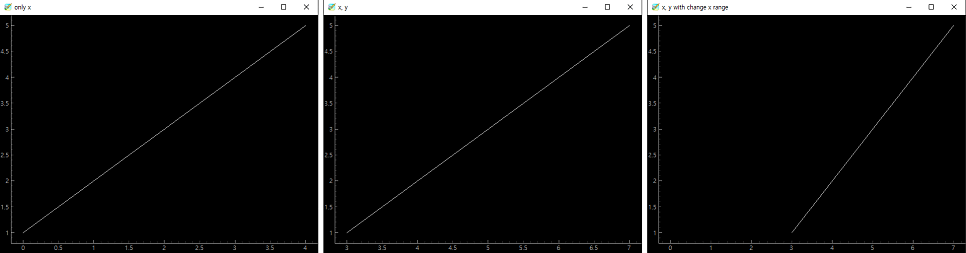
pg.plot(value) 명령으로 선형차트를 그릴 수 있다.
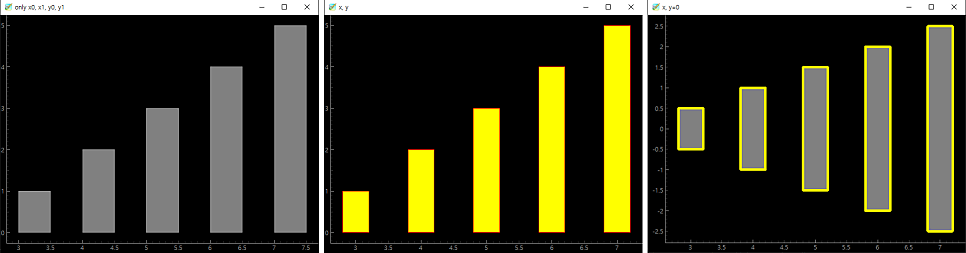
x, y값을 구분해서 전달하고 싶다면 pg.plot(x=x, y=y)와 같은 식으로 전달하면 된다.
import pyqtgraph as pg

x = [3, 4, 5, 6, 7]
y = [1, 2, 3, 4, 5]

pg.plot(y, title='only x')

pg.plot(x=x, y=y, title='x, y')

widget = pg.plot(x=x, y=y, title='x, y with change x range')
widget.setXRange(0, max(x))

pg.exec()